

Capital Product Partners L.P. Announces Third Quarter 2019 Financial Results
As previously announced, the share-for-share transaction with
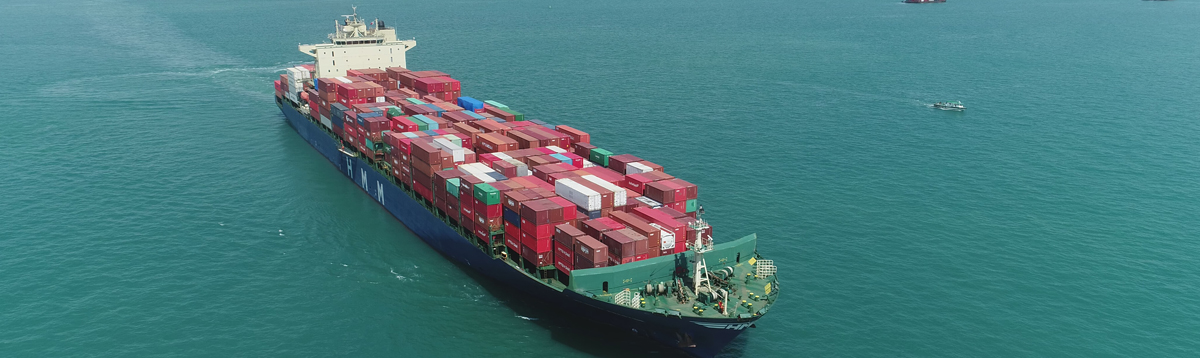
We currently own a fleet of 11 vessels, consisting of ten Neo-Panamax container vessels and one drybulk vessel. For the third quarter 2018, our financial results from continuing operations include revenues, expenses and cash flows arising from, in addition to our current 11 vessels, the M/T Amore Mio II, which we sold and delivered on
All per unit data in this release have been retrospectively adjusted to reflect the impact of the one-for-seven reverse unit split we effected on
Overview of Third Quarter 2019 Results
Net income from continuing operations for the quarter ended
Total revenue was
Total expenses for the quarter ended
Total other expense, net for the quarter ended
Capitalization of the Partnership
As of
As of
As of
Operating Surplus
Operating surplus from continuing operations for the quarter ended
Fleet Employment Update
As previously announced, the M/V Agamemnon (108,892 dwt / 8,266 TEU, container carrier built 2007,
As a result, the Partnership’s charter coverage for the remainder of 2019, 2020 and 2021 currently stands at 100%, 90% and 67%, respectively.
Quarterly Common Unit Cash Distribution
On
Market Commentary
Neo-Panamax Container Market
The Neo-Panamax container charter market for 8,000+ TEU vessels remained tight over the quarter, as there is limited vessel availability for the remainder of the year. As a result, most vessels have been fixed in advance at increasing charter rates and longer periods.
Off-hire related to scrubber installation continues to underpin the charter market, as off-hire periods have so far exceeded in most cases the original forecasts due to shortage of dry-docking space, materials and manpower.
Analysts estimate that the idle fleet presently stands at around 3.3% of the total worldwide container fleet including vessels out of service for scrubber retrofits.
The container orderbook is estimated to be close to historic lows and as of the end of
Container demolition for the first nine months of the year is estimated at 153,919 TEU, compared to 45,060 TEU for the same period last year.
Full year demand growth projection has decreased to 2.4% and, for the first time this year, is expected to be outstripped by supply growth of 3.7%, before accounting for container vessel off-hire related to scrubber retrofits.
Management Commentary
Mr.
“We are pleased to have concluded the first scrubber retrofit on the M/V Agamemnon and to see the vessel subsequently deliver under its new long-term charter until 2024. The scrubber retrofit combined with passing of the special survey of the vessel and the associated off hire, as well as certain additional one-off expenses incurred this quarter have negatively affected our common unit coverage. While we expect the scrubber retrofits on at least six additional vessels over the coming months to generate additional volatility in our operating income and common unit coverage, we believe that once the retrofits have been completed, the Partnership will benefit in the long run from increased cash flow generation and visibility.
In the meantime, the Partnership’s strong balance sheet and cash position give us the opportunity to expand our asset base with a view to growing our long-term distributable cash flow.”
Conference Call and Webcast
Today,
Conference Call Details
Participants should dial into the call 10 minutes before the scheduled time using the following numbers: 1 877 55 39962 (U.S. Toll Free Dial In), 0808 238 0669 (UK Toll Free Dial In) or +44 (0)2071 92 8592 (Standard International Dial In). Please quote “Capital Product Partners.”
A replay of the conference call will be available until
Slides and Audio Webcast
There will also be a simultaneous live webcast over the Internet, through the
About
For more information about the Partnership, please visit: www.capitalpplp.com.
Forward-Looking Statements
The statements in this press release that are not historical facts, including, among other things, the expected financial performance of CPLP’s business, CPLP’s ability to pursue growth opportunities, CPLP’s expectations or objectives regarding future distributions, and market and charter rate expectations are forward-looking statements (as such term is defined in Section 21E of the Securities Exchange Act of 1934, as amended). These forward-looking statements involve risks and uncertainties that could cause the stated or forecasted results to be materially different from those anticipated. For a discussion of factors that could materially affect the outcome of forward-looking statements and other risks and uncertainties, see “Risk Factors” in CPLP’s annual report filed with the
CPLP-F
Contact Details:
Jerry Kalogiratos
CEO
Tel. +30 (210) 4584 950
E-mail: j.kalogiratos@capitalpplp.com
Nikos Kalapotharakos
CFO
Tel. +30 (210) 4584 950
E-mail: n.kalapotharakos@capitalmaritime.com
Investor Relations / Media
Capital Link, Inc. (
Tel. +1-212-661-7566
E-mail: cplp@capitallink.com
Source:
Unaudited Condensed Consolidated Statements of Comprehensive Income
(In thousands of United States Dollars, except for number of units and earnings per unit)
| For the three-month periods ended September 30, |
For the nine-month periods ended September 30, |
|||||||
| 2019 | 2018 | 2019 | 2018 | |||||
| Revenues | 26,439 | 31,784 | 80,673 | 89,317 | ||||
| Revenues – related party | - | - | - | 701 | ||||
| Total revenues | 26,439 | 31,784 | 80,673 | 90,018 | ||||
| Expenses: | ||||||||
| Voyage expenses | 726 | 2,828 | 1,852 | 8,291 | ||||
| Vessel operating expenses | 8,790 | 6,505 | 19,929 | 20,535 | ||||
| Vessel operating expenses - related party | 994 | 1,067 | 2,922 | 3,229 | ||||
| General and administrative expenses | 1,499 | 1,339 | 3,486 | 4,525 | ||||
| Vessel depreciation and amortization | 7,336 | 8,403 | 21,811 | 25,578 | ||||
| Impairment of vessel | - | 28,805 | - | 28,805 | ||||
| Operating income / (loss) | 7,094 | (17,163 | ) | 30,673 | (945 | ) | ||
| Other income / (expense), net: | ||||||||
| Interest expense and finance cost | (4,137 | ) | (4,738 | ) | (13,171 | ) | (14,304 | ) |
| Other income | 403 | 182 | 1,123 | 693 | ||||
| Total other expense, net | (3,734 | ) | (4,556 | ) | (12,048 | ) | (13,611 | ) |
| Partnership’s net income / (loss) from continuing operations | 3,360 | (21,719 | ) | 18,625 | (14,556 | ) | ||
| Preferred unit holders’ interest in Partnership’s net income from continuing operations | - | 2,776 | 8,996 | 8,326 | ||||
| General Partner’s interest in Partnership’s net income / (loss) from continuing operations | 63 | (461 | ) | 181 | (431 | ) | ||
| Common unit holders’ interest in Partnership’s net income / (loss) from continuing operations | 3,297 | (24,034 | ) | 9,448 | (22,451 | ) | ||
| Partnership’s net income / (loss) from discontinued operations | 34 | (910 | ) | (146,704 | ) | 1,214 | ||
| Partnership’s net income / (loss) | 3,394 | (22,629 | ) | (128,079 | ) | (13,342 | ) | |
| Net income / (loss) from continuing operations per: | ||||||||
| ·Common unit, basic and diluted | 0.18 | (1.33 | ) | 0.52 | (1.24 | ) | ||
| Weighted-average units outstanding: | ||||||||
| ·Common units, basic and diluted | 18,178,100 | 18,100,241 | 18,178,100 | 18,100,241 | ||||
| Net (loss) / income from discontinued operations per: | ||||||||
| ·Common unit, basic and diluted | - | (0.04 | ) | (7.92 | ) | 0.07 | ||
| Weighted-average units outstanding: | ||||||||
| ·Common units, basic and diluted | 18,178,100 | 18,100,241 | 18,178,100 | 18,100,241 | ||||
| Net income/(loss) from operations per: | ||||||||
| ·Common unit, basic and diluted | 0.18 | (1.37 | ) | (7.40 | ) | (1.17 | ) | |
| Weighted-average units outstanding: | ||||||||
| ·Common units, basic and diluted | 18,178,100 | 18,100,241 | 18,178,100 | 18,100,241 | ||||
Unaudited Condensed Consolidated Balance Sheets
(In thousands of United States Dollars)
| Assets | |||
| Current assets | As of September 30, 2019 |
As of December 31, 2018 |
|
| Cash and cash equivalents | 58,688 | 21,203 | |
| Trade accounts receivable, net | 5,097 | 16,126 | |
| Prepayments and other assets | 2,148 | 2,017 | |
| Inventories | 1,345 | 1,516 | |
| Current assets from discontinued operations | - | 23,698 | |
| Total current assets | 67,278 | 64,560 | |
| Fixed assets | |||
| Vessels, net | 568,652 | 586,100 | |
| Total fixed assets | 568,652 | 586,100 | |
| Other non-current assets | |||
| Above market acquired charters | 49,900 | 60,655 | |
| Deferred charges, net | 968 | - | |
| Restricted cash | 5,500 | 16,996 | |
| Prepayments and other assets | 6,371 | 2,466 | |
| Non-current assets from discontinued operations | - | 654,468 | |
| Total non-current assets | 631,391 | 1,320,685 | |
| Total assets | 698,669 | 1,385,245 | |
| Liabilities and Partners’ Capital | |||
| Current liabilities | |||
| Current portion of long-term debt, net | 29,759 | 37,479 | |
| Trade accounts payable | 10,660 | 14,348 | |
| Due to related parties | 3,956 | 17,742 | |
| Accrued liabilities | 9,906 | 16,740 | |
| Deferred revenue, current | 1,665 | 7,315 | |
| Current liabilities from discontinued operations | - | 21,535 | |
| Total current liabilities | 55,946 | 115,159 | |
| Long-term liabilities | |||
| Long-term debt, net | 236,675 | 253,932 | |
| Deferred revenue | - | 96 | |
| Long-term liabilities from discontinued operations | - | 134,744 | |
| Total long-term liabilities | 236,675 | 388,772 | |
| Total liabilities | 292,621 | 503,931 | |
| Commitments and contingencies | |||
| Total ppartner’s’ capital | 406,048 | 881,314 | |
| Total liabilities and partners’ capital | 698,669 | 1,385,245 | |
Unaudited Condensed Consolidated Statements of Cash Flows
(In thousands of United States Dollars)
| For the nine-month periods ended September 30, |
||||||
| 2019 | 2018 | |||||
| Cash flows from operating activities of continuing operations: | ||||||
| Net income / (loss) from continuing operations | 18,625 | (14,556 | ) | |||
| Adjustments to reconcile net income / (loss) to net cash provided by operating activities of continuing operations: | ||||||
| Vessel depreciation and amortization | 21,811 | 25,578 | ||||
| Amortization of deferred financing costs | 822 | 1,027 | ||||
| Amortization of above market acquired charters | 10,755 | 10,755 | ||||
| Equity compensation expense | 462 | 611 | ||||
| Impairment of vessel | - | 28,805 | ||||
| Changes in operating assets and liabilities: | - | |||||
| Trade accounts receivable, net | 11,029 | (9,604 | ) | |||
| Prepayments and other assets | (1,040 | ) | (1,062 | ) | ||
| Inventories | 171 | 600 | ||||
| Trade accounts payable | (7,385 | ) | 4,504 | |||
| Due to related parties | (13,786 | ) | 6,127 | |||
| Accrued liabilities | (7,426 | ) | 3,224 | |||
| Deferred revenue | (5,746 | ) | (7,920 | ) | ||
| Net cash provided by operating activities of continuing operations | 28,292 | 48,089 | ||||
| Cash flows from investing activities of continuing operations: | ||||||
| Vessel improvements | (3,653 | ) | (372 | ) | ||
| Proceeds from sale of vessel | - | 28,862 | ||||
| Net cash (used in) / provided by investing activities of continuing operations | (3,653 | ) | 28,490 | |||
| Cash flows from financing activities of continuing operations: | ||||||
| Deferred financing costs paid | (770 | ) | (72 | ) | ||
| Payments of long-term debt | (25,030 | ) | (40,927 | ) | ||
| Redemption of Class B unit holders | (116,850 | ) | - | |||
| Dividends paid | (22,935 | ) | (39,450 | ) | ||
| Net cash used in financing activities of continuing operations | (165,585 | ) | (80,449 | ) | ||
| Net decrease in cash, cash equivalents and restricted cash from continuing operations | (140,946 | ) | (3,870 | ) | ||
| Cash flows from discontinued operations | ||||||
| Operating activities | 9,081 | 24,083 | ||||
| Investing activities | (374 | ) | (40,459 | ) | ||
| Financing activities | 158,228 | (13,740 | ) | |||
| Net increase / (decrease) in cash, cash equivalents and restricted cash from discontinued operations | 166,935 | (30,116 | ) | |||
| Net increase / (decrease) in cash, cash equivalents and restricted cash | 25,989 | (33,986 | ) | |||
| Cash, cash equivalents and restricted cash at beginning of period | 38,199 | 71,297 | ||||
| Cash, cash equivalents and restricted cash at end of period | 64,188 | 37,311 | ||||
| Supplemental cash flow information | ||||||
| Cash paid for interest | 16,356 | 18,439 | ||||
| Non-Cash Investing and Financing Activities | ||||||
| Capital expenditures included in liabilities | 3,863 | 711 | ||||
| Capitalized dry docking costs included in liabilities | 995 | 1,424 | ||||
| Assumption of loan regarding the acquisition of the shares of the companies owning the M/T Aristaios and the M/T Anikitos included in discontinued operations | - | 43,958 | ||||
| Reconciliation of cash, cash equivalents and restricted cash | ||||||
| Cash and cash equivalents | 58,688 | 19,367 | ||||
| Restricted cash - Non-current assets | 5,500 | 17,944 | ||||
| Total cash, cash equivalents and restricted cash shown in the statements of cash flows | 64,188 | 37,311 | ||||
Appendix A – Reconciliation of Non-GAAP Financial Measure
(In thousands of U.S. dollars)
Description of Non-GAAP Financial Measure – Operating Surplus
Operating Surplus represents net income/(loss) adjusted for depreciation and amortization expense, impairment of vessel, amortization of above market acquired charters and straight-line revenue adjustments.
Operating Surplus is a quantitative measure used in the publicly traded partnership investment community to assist in evaluating a partnership’s financial performance and ability to make quarterly cash distributions. Operating Surplus is not required by accounting principles generally accepted in
| Reconciliation of Non-GAAP Financial Measure – Operating Surplus | For the three-month period ended September 30, 2019 |
For the three-month period ended June 30, 2019 |
For the three-month period ended September 30, 2018 |
|||
| Partnership’s net income / (loss) from continuing operations | 3,360 | 8,035 | (21,720 | ) | ||
| Adjustments to reconcile net income / (loss) to operating surplus prior to Capital Reserve and Class B Preferred Units distribution | ||||||
| Depreciation and amortization1 | 8,074 | 7,515 | 8,829 | |||
| Amortization of above market acquired charters and straight-line revenue adjustments | 1,270 | 1,304 | 1,409 | |||
| Impairment of vessel | - | - | 28,805 | |||
| Operating Surplus from continuing operations | 12,704 | 16,854 | 17,323 | |||
| Add: Operating Surplus / (Deficit) from discontinued operations | 34 | (203 | ) | 10,037 | ||
| Total Operating Surplus from operations | 12,738 | 16,651 | 27,360 | |||
| Capital reserve | (7,703 | ) | (7,703 | ) | (13,597 | ) |
| Class B preferred units’ distributions2 | - | - | (2,776 | ) | ||
| Operating Surplus after capital reserve and Class B Preferred Units distribution | 5,035 | 8,948 | 10,987 | |||
| Decrease / (increase) in recommended reserves | 801 | (3,112 | ) | (612 | ) | |
| Available Cash | 5,836 | 5,836 | 10,375 | |||
1Depreciation and amortization line item include the following components:
- Vessel depreciation and amortization; and
- Deferred financing costs and equity compensation plan amortization.
2 All outstanding Class B Units were redeemed on
![]()
Source: Capital Product Partners, L.P.